Your cart is currently empty!

From Satellite to Community: The Journey of Earth Observation Data
—
Every day, dozens of Earth observation satellites orbit our planet, collecting terabytes of data about environmental conditions from space. These sensors capture everything from water surface extent and soil moisture to vegetation health and precipitation patterns. Yet for all its precision and comprehensiveness, this valuable information often remains inaccessible to the communities that could benefit most from it.
Transforming raw satellite data into actionable insights requires a series of complex processes that bridge the technical gap between remote sensing specialists and community decision-makers. Tethys applications play a crucial role in this transformation, helping Earth scientists convert complex satellite observations into tools that inform real-world decisions.
From Raw Data to Meaningful Information
The first step in making satellite data useful involves transforming raw sensor readings into standardized, calibrated measurements. This process includes radiometric corrections that account for atmospheric conditions, geometric corrections that ensure accurate positioning, and various transformations that convert sensor readings into meaningful physical parameters.
The Water Mapping App exemplifies this transformation. Developed by Kel Market and Kailey Mohamed, this application leverages the HYDRAFloods Python package to generate surface water maps from satellite imagery. The underlying technology provides sensor-agnostic approaches to process multiple remote sensing datasets, delivering daily surface water information particularly valuable for flood applications.
What makes this application significant isn’t just its technical sophistication but its ability to handle the complex processing automatically. Rather than requiring users to understand the intricacies of satellite data processing, the application manages these steps behind the scenes, allowing users to focus on the resulting information rather than how it was derived.
Extracting Insights from Observations
Once processed, satellite data must be analyzed to extract meaningful patterns and relationships. This step often involves combining observations from multiple sensors or incorporating them with other data sources to provide context and deeper understanding.
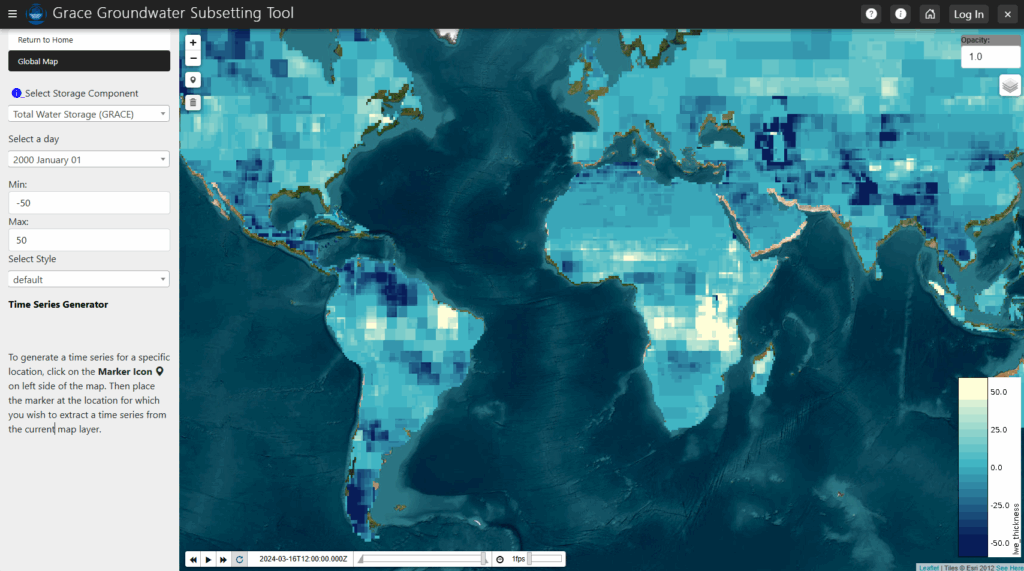
The GRACE Groundwater Subsetting Tool demonstrates this analytical transformation. By combining data from NASA’s Gravity Recovery and Climate Experiment (GRACE) satellites with land surface models from the Global Land Data Assimilation System (GLDAS), the application extracts groundwater storage change estimates for selected regions. This analysis goes beyond what either dataset could provide independently, creating new insights about a critical but often invisible resource.
Similarly, the Eastern & Southern Africa GEOGLOWS Dashboard integrates multiple satellite-derived datasets to provide a comprehensive view of water-related metrics across the region. By analyzing patterns across these datasets, the application helps users understand relationships between different environmental factors and their implications for water resource management.
Making Information Accessible
Even after processing and analysis, satellite-derived information remains challenging to interpret without effective visualization. Earth scientists must transform complex datasets into visual representations that communicate key patterns and relationships clearly.
The Drought Watch application exemplifies effective visualization of satellite data. By presenting information on evapotranspiration, precipitation, soil moisture, and temperature through intuitive maps and graphs, it enables users to quickly assess drought conditions and outlooks. The visualization focuses attention on the most relevant patterns, helping users understand both current conditions and potential future trends.
Effective visualization determines whether satellite-derived information will be understood and used effectively. Well-designed visualizations reduce cognitive load, highlight meaningful patterns, and support intuitive understanding of complex environmental processes.
Improving Through Use
The journey of satellite data doesn’t end when it reaches communities. As users apply the information to real-world decisions, they generate valuable feedback about its usefulness and limitations. This feedback creates opportunities to refine applications, improving how they process, analyze, visualize, and integrate satellite observations.
The open-source nature of Tethys Platform facilitates this iterative improvement. When users identify limitations or suggest enhancements, developers can respond by updating applications to better meet community needs. This responsiveness ensures that applications evolve alongside both advances in satellite technology and changes in community priorities.
Building Better Bridges
As satellite technology continues to advance, the opportunities for transforming Earth observation data into valuable community tools will only expand. Future applications will likely incorporate data from new sensors, implement more sophisticated analysis techniques, and connect to an even wider range of decision contexts.
Through platforms like Tethys, the journey from satellite to community becomes more accessible, allowing more Earth scientists to contribute to this important transformation. As these connections strengthen, we improve our collective ability to understand and protect the environmental systems on which communities worldwide depend.
To learn more about how Tethys applications can help you transform satellite data into community tools, explore our resources and join our growing community of Earth scientists and developers working to make environmental information more accessible and actionable.
Leave a Reply